Optia makes your data AI-ready so you become AI-confident.
Trusted data. Clear Answers. Confident decisions.
Solutions
TheOrderMatters
You know AI is changing the way we work. Knowing what to do about it and where to start is hard. Real, measurable success with AI depends on three progressive layers:
Foundation: The right data
Context: Give the data meaning
Intelligence: Know what to do next.
Without these, AI initiatives fail. Optia builds all three for you.
Foundation
Get the data right.
We bring together your data: syndicated market, sales and marketing or your own internal numbers, creating one governed, audited and secure environment. Your data, reconciled and reliable, with a clear trail from which every figure originates. The result? Numbers that match and reporting that runs itself. Most people undervalue this, which is why any AI will give confident, wrong answers
Context
Give your data meaning.
Data on its own doesn't know your categories, your definitions, your hierarchies or your quirks. We codify that meaning in a managed layer: the business rules, definitions and relationships that let your people - and any AI - read your data correctly.
Intelligence
Know what to do next.
Dashboards, ad-hoc answers and enhanced analysis. Every insight identifies real value and how to unlock it. Every recommendation is provided to improve your business, based on your governed data. All verified by a human analyst. Decisions made with confidence. Actionable insights not vanity metrics.
FoundationContextIntelligence
Not sure which of these layers fits with where you are today?
Optia's rule-driven framework harmonises and standardises the data. You get an automated, audited process that creates a clean raw data lakehouse to work with. We then work with you to build data transformation pipelines over this, producing data optimised for analysis in your BI tool of choice.
Context
Give the data meaning
Data catalogue and context layer
Our foundational data engineering processes build a governed catalogue of definitions, business rules and lineage. You get two key things: standardised metrics to work with, and pre-calculated datasets, leaving no scope for LLMs to hallucinate or imagine numbers.
Intelligence
Know what to do next.
Model Context Protocol over your data
Your harmonised data made available through MCP, so CoPilot and other AI assistants can query it directly, governed by the same permissions, lineage and named-analyst accountability as the rest of the platform.
Customers
Trusting Optia. Earned, not assumed.
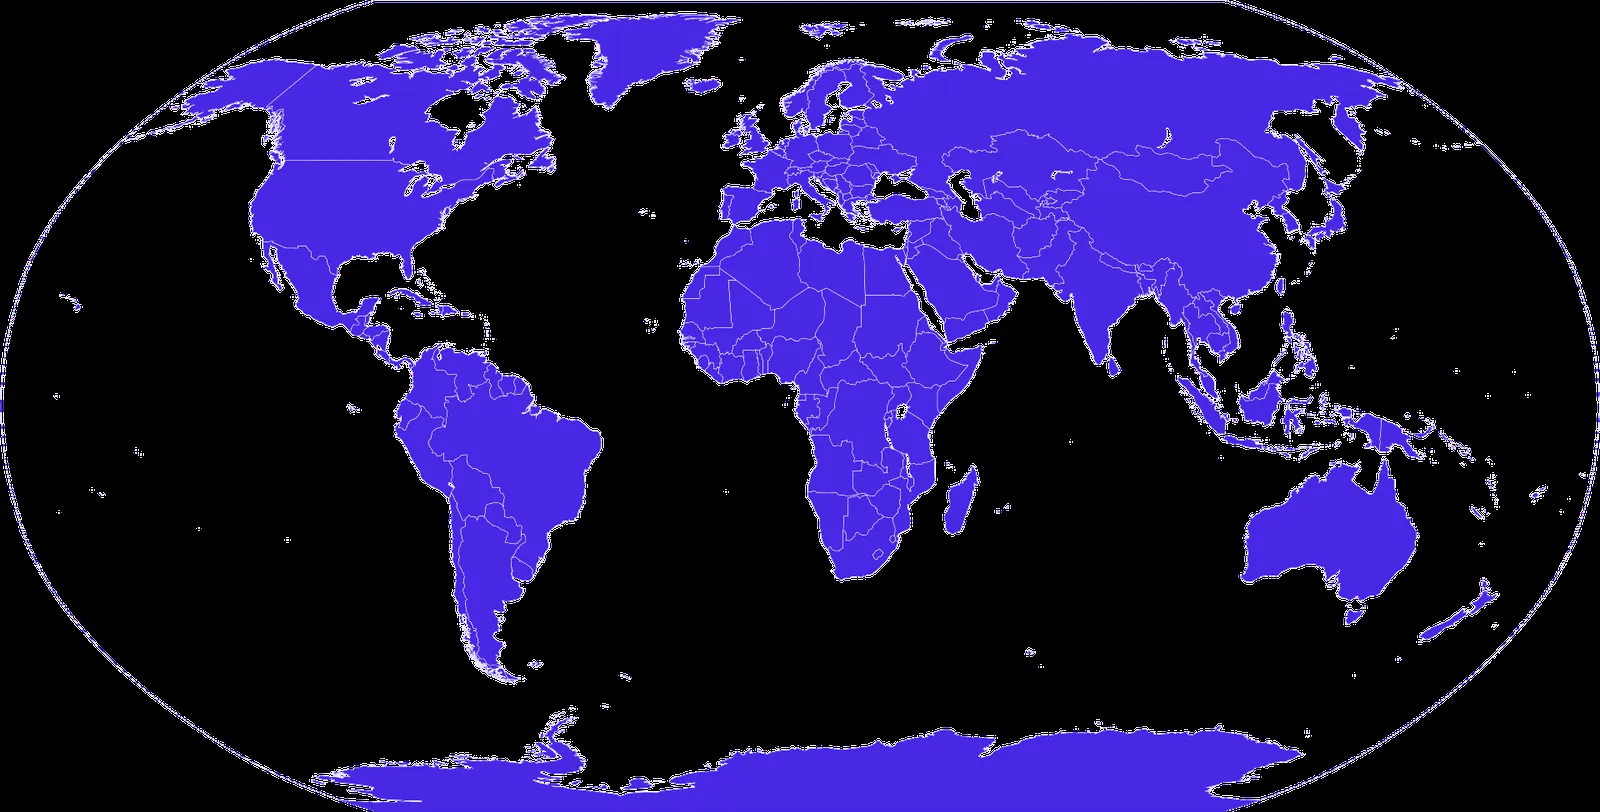
We help consumer businesses unlock more value from complex, costly, syndicated data; this is where we have the most experience and our greatest relationships. The same engineering also serves clients in industrial, health, education, financial services consumer electronics verticals.
A retailer range review is built on products mapped to the wrong category.
The recommendation is confident. The evidence underneath it is not.
The board wants an AI strategy.
The data powering it is still not ready.
This is not an analyst problem. It is a commercial risk.
Capable teams are being asked to make major decisions using brittle, patched up spreadsheets. When syndicated data doesn’t reconcile with internal systems, a retailer feed silently drops products, or one incorrect SKU distorts an entire forecast, it is not the data that gets questioned. It is the person presenting it.
Optia catches and resolves discrepancies before they reach your category reporting, a board pack or a buyer meeting, so your teams have confidence in their numbers.
Pick the week that looks like yours.
The week
Monday’s question gets Friday’s answer.
Your analysts spend the week assembling exports, reconciling definitions and rebuilding the baseline. By the time they can investigate the question, the commercial conversation has already moved on.
What changes
Start with the question.
Optia delivers one harmonised, analysis-ready baseline across retailer, syndicated and internal data. Your team investigates what changed, why it changed and what to do next, without rebuilding the data first.
The week
You know performance changed. You cannot explain why.
Was it distribution, availability, range, price or promotion? When the buyer asks, your team is still reconciling the evidence instead of presenting the opportunity.
What changes
Walk in knowing what changed and why.
Optia connects retailer performance, market context and your own, bespoke category definitions on one governed baseline. Every recommendation is supported by evidence you can trace, explain and defend.
The week
The promotion ends before the answer arrives.
Spend sits in one file, retailer sales in another and volume uplift somewhere else. By the time the evaluation is complete, the next promotion has already been committed.
What changes
Know what worked while you can still act on it.
Optia connects spend, price, volume and margin by promotion, retailer and SKU. You can see what created genuine incremental value via A/B testing and adjust the next decision before the budget is gone.
The week
The meeting starts with whose number is right.
Finance, sales and category arrive with different versions of performance. Leadership time is spent reconciling the past instead of deciding what happens next.
What changes
One single source of truth.
Optia creates a governed, traceable view of performance across the business. Every team works from the same figures, every number has a source and meetings move from reconciliation to action.
One trusted baseline. Every team aligned. Better decisions, made faster.
Most advice starts with choosing a model, buying a platform or deploying a chatbot. Or being told to use Copilot.The hardest part isn't choosing the right AI tools. It's having trustable, AI usable data available.Ask the most sophisticated model a question over fragmented, contradictory or poorly governed data and you'll receive a confident answer. It just may not be the correct one.We don't begin with AI. We begin with trust.
We build confidence before intelligence.
Every engagement follows the same principle.First, we understand how your business makes decisions.Then we bring together all your data sources: syndicated market data, retailer data and your internal systems into one governed, auditable foundation.Next, we capture the business rules, hierarchies and commercial context that give your data meaning.Then do we apply AI.The result isn't simply better reporting. It's intelligence your teams can act on with confidence.
Technology accelerates the work. People remain accountable.
Usable AI, not AI for the sake of it.
Some organisations need predictive modelling. Others need workflow automation. Some simply need reporting they can finally trust.Our role isn't to sell you "AI". It is to recommend the right combination of data engineering, analytics, automation and Practical Intelligence for your business today, while creating foundations that allow you to adopt more advanced AI when the time is right.Sometimes AI is the answer. Sometimes it isn't. We'll tell you the difference.
Core
For the people who have to trust this too.
If you own data or IT, you're the one who has to be comfortable with how this works. Here's the straight version.
Governance
Optia runs all your data processes in a code and data versioned setup. We maintain full lineage of every change so that you don't need to deal with any surprises. Our data analysts and engineers have years of experience in dealing with data coming from myriad companies and in particular retail data providers, with whom we have data sharing partnerships. This experience allows us to build a wide range of data audits so we catch issues early.
Security
Optia's processes are ISO27001:2022 certified. This means that we have been rigorously tested on best practices on data, infrastructure and process security. A lot of infrastructure build now happens through agents. We have skilled them to do any activity ground up, taking into account the strictest security controls.
Attended agents
We are big fans of conventional, top notch software. While AI Agents help us write logic and processes in an attended setup, we do not deploy them to take any autonomous un-attended decisions on your data. Every data exception is human understood, corrected and validated. Our experience has taught us where the efficiencies of AI are but equally what the risks are. Rest assured, your data is in safe hands.
Our experience has taught us where the efficiencies of AI are, but equally what the risks are. Your data is in safe hands.
The story behind Optia, in our founder's own words.
Our story
(unedited from our founder...)
Until a couple of years ago, we were a software company, with (so we thought) a very cool self serve, no code (remember that?) data management platform. However, more often than not we were using the tool on behalf of our customers and then taking the cleaned data it provided to create automated reporting for them. We began to realise that our customers (and prospective ones!) did not really want more software forced on them. Software that promised the world but invariably failed to deliver. Software that purported to do the work of others, but which actually only gave them more work to do. They just wanted the hard work done for them. Why? Because 80% (and growing) of their time was spent trying to do this hard work when they wanted to be spending 100% of their time doing their actual jobs, doing stuff that really adds value, makes them look good, enjoy their work, get promoted, earn more…
So we launched Optia Data to help people do all that and more. We started as a data services company, with a focus on CPG/FMCG as this is where we had the most knowhow. In actual fact, as you have seen elsewhere on this site, we serve customers from many different industries all over the world. It turns out that wherever there is a lot of data, people who have to deal with it are in pain. We are here to help those people, whatever their business.
They just wanted the hard work done for them.
In light of the growing impact of AI, we repositioned ourselves to help our customers use not just data, but AI to their advantage. But to see AI as a productivity tool and not a threat. Helping people to work out where to start. AI is certainly 'promising the world' at the moment. But while recent findings suggest that in the majority of cases it is failing to deliver, it is our job to help you win with it, as the real winners will be those who use AI properly. Luckily, that requires all the skillsets that we have been developing over the last 15 years. Because, believe it or not, AI (in its Machine Learning guise) has been around for a long time. Today, anyone can use AI to spin something up quickly, but it is those who have the depth of understanding, learned over years, who can make it reliable and scalable on an ongoing basis. Today anyone can ask AI a question, but only those who have invested in creating that data foundation and context can expect an accurate answer.
It is daunting for a lot of people. But it needn't be. And it probably won't be in time. And it certainly won't be if you start now. Allow us to help, human to human. If you trust us to help you trust your own data, maybe you'll trust us to help you as this space continues to evolve.
Allow us to help, human to human.
Who we are
We're a specialist data company with deep expertise and partnerships in consumer, but with a growing reputation in other fields. My team covers all the bases. Data and Software engineering expertise gained over decades from the best technical universities and Fortune 500 companies. Bleeding edge innovation skills honed in the labs of the most forward thinking global management consultancies and CPG behemoths. Analyst skillsets influenced by years working in and for CPGs and digital startups alike. Customer success, empathy and an innate understanding of what someone needs that can only have been honed on the playing fields of England.
We have spent years in the detail of syndicated datasets, doing the unglamorous work that makes commercial numbers reliable for big household names. We are human, we are diverse, we are located all around the world and have the ability to listen to the needs of our customers and then work out and implement the best possible solution available today. Every project we take on is either slightly different to the previous, or very different. All this coupled with backgrounds building and maintaining data platforms and softwares and natural curiosity that is seeing us test and push the boundaries of the latest technologies, mean that our customers want us not just to solve the problem at hand, but to join them wherever they are on their data journey.
Why a name matters
We have always known that the data to insights journey is fraught with issues of 'garbage in garbage out'. The challenge conversational AI poses is that it may make even garbage look interesting and correct. Conversational AI must be fed data that is correct by design and also presented in a way that means the LLMs have a miniscule chance of hallucinating or cooking up something random. This requires strong data foundations and data presentation skills. At Optia, we have understood these challenges and are continuously on a mission to improve our capabilities around these emerging challenges.
Specifically, we strongly believe in having a grown up (human) in the room. As such every output we deliver has a person behind it: a named analyst who has checked the number and will stand by it. In a market rushing to automate the human away, we think the human is the point. Trust is earned, not claimed.
In fact, when you work with Optia, you always have a real person to talk to and to meet; someone who is accountable. And with Optia's leadership team in five countries and across three continents, we are always available and ready to share our combined three digit years of experience in working in data.
Fifteen engagements, from a single dashboard to a five-year platform. Every one started with numbers somebody did not trust, and ended with a view they could act on.
One trusted view of brand and category performance across 16 markets
How Arla replaced a 20-day reporting process with an always-ready view of market, brand, category and retailer performance.
20 days to 10 minutesMonthly reporting cycle
16markets compared through one consistent commercial model
20d → 10minto produce monthly market reporting
100+dashboard opens a day across brand, insight, category and commercial teams
366+brands and 1bn+ rows processed and standardised every month
The challenge
Arla operates across markets ranging from the UK and the Nordics to Turkey, the UAE and Saudi Arabia. Each market supplied Nielsen data using its own product and category hierarchies, reporting calendars, currencies, and brand and SKU naming conventions.
This made it difficult for brand, insight and category teams to answer straightforward questions. Which brands were gaining share? Was growth coming from price, volume or distribution? How did private label performance compare by market?
Producing a consolidated view required around 20 days of manual preparation every month. The final output was a static report that was already becoming outdated by the time it reached decision-makers. Considerable effort went into assembling and reconciling the numbers, leaving less time to interpret what they meant and decide what to do next.
What we changed
Optia created a single, consistent model for Nielsen reporting across all 16 markets. Every month, 60+ source files are automatically processed, checked and mapped into a common structure covering more than 366 brands and every relevant SKU.
Differences in currencies, reporting periods, product classifications and naming conventions are resolved before the information reaches users. The Power BI environment sits inside Arla's own systems rather than on infrastructure held by Optia. It gives Arla's teams a consistent view of value, volume and unit-price performance, brand and private-label market share, distribution, sales momentum, new product performance, and retailer and market-level results.
Automation alone was not enough. Optia introduced validation and quality controls that identify unusual movements, missing information and inconsistencies before they affect reporting. These checks have surfaced a 130% growth spike in the Danish data traced to SKU-level reporting errors and fed back to NIQ for correction, masked brand data in Switzerland requiring a bespoke method to reconcile to dataset totals, and Lira-denominated Turkish sales that overwhelm EMEA comparisons, now reported in converted currency both with and without Turkey. Rather than letting these problems pass into reports, Optia works with Arla and its data providers to investigate and correct them at source.
The results
Arla reports that the monthly reporting cycle has been reduced from around 20 working days to around 10 minutes. The platform now supports around 50 users and is opened more than 100 times on an average working day.
Across the engagement, Arla has benefited from faster identification of brand and category opportunities, consistent comparison across markets, earlier visibility of pricing, share and distribution changes, less manual data preparation, and greater confidence in the numbers used by commercial teams and leadership.
The platform has continued to evolve since launch. Optia holds regular operational reviews, updates classifications as products and categories change, and adapts the model as the business grows, which is why it remains widely used five years later.
In their words
“Partnering with Optia has completely transformed how we manage data. Their automated reporting and real-time insights have not only improved our operational efficiency but also accelerated decision-making and positioned us for scalable growth.”
International Category and Commercial Excellence Lead, Arla Foods
“Nielsen data across 16 markets is a very complex yet structured dataset, so a great candidate to extract value with the power of Optia Data.”
Arla Foods
Is this your problem too?
Tell us what is slowing your commercial decisions down and we will show you how we would approach it, including a free assessment.
Trusted category insight, protected before it reaches the board
How Australian Vintage uncovered £26 million of misclassified category sales, recovered hundreds of missing products, and turned a manual reporting process into an accessible source of commercial insight.
£26mof misclassified category sales identified and corrected
~793SKUs recovered from an incomplete data delivery
Days → hrsto validate and publish monthly reporting
11pages of analysis available to brand, category and commercial teams
The challenge
The UK and Ireland represent Australian Vintage's largest market region, making accurate category reporting essential for leadership updates, customer conversations and brand planning. Each month, the category team had to consolidate and validate market data manually before it could be used.
Two issues demonstrated the commercial risk. A recurring classification problem within the no and low alcohol category placed a significant volume of sales under an unidentified varietal and private label, misstating approximately £26 million of category performance. This was a restatement of how sales were reported, not revenue recovered. In a separate delivery, around 793 SKUs disappeared from the reported market following changes to product classifications. The products had not stopped selling; the reported view simply no longer included them correctly.
Without detailed checks, these issues could have affected board reporting, category conclusions and the interpretation of brand and competitor performance.
What we changed
Optia built a reporting environment covering total category performance, top brands and manufacturers, no and low alcohol, country of origin, brand and sub-brand, varietal, wine colour, retailer performance, and value and volume market share across four-week, twelve-week, financial year-to-date and moving annual total views. Ireland is reported separately in local currency for the regional team.
Optia introduced validation controls that compare each new delivery against expected product counts, category totals, classifications and historical patterns. When something changes unexpectedly, the system flags it for investigation before publication. This process identified both the varietal classification issue and the disappearance of around 793 SKUs. Optia documented the evidence, worked with the source provider to establish what had happened, and secured corrected historical data.
The environment was also designed to be visual, intuitive and easy to navigate, so colleagues who don't work with market data every day could move from a high-level category view into the detail behind a particular brand, SKU, retailer or varietal without help. Training and rollout support helped the wider team use the dashboard confidently.
The results
Australian Vintage now has a more reliable and efficient way to prepare category information for leadership and commercial decision-making: approximately £26 million of misclassified category sales corrected in the reported view, around 793 missing SKUs recovered, and full historical reporting rebuilt. Australian Vintage reports monthly validation effort falling from days to hours.
On one occasion, the team was able to validate, correct and deliver the required reporting over a weekend in time for a Monday board meeting.
In their words
“People are really unfamiliar with data. Having something visual and easy to use is beneficial for the people who are not working with data all the time. At least now I can show people in our company, just click on this tab. It is very easy.”
Category Insights Manager, Australian Vintage
“Optia have done all they can, been very responsive and supportive over the last couple of weeks. Please pass on my thanks to them.”
Senior Category Insight Manager, Australian Vintage
Is this your problem too?
Tell us what is slowing your commercial decisions down and we will show you how we would approach it, including a free assessment.
One trusted weekly view across four major retailers
How Golden Acre Foods created a consistent view of retailer and category performance, rebuilt two years of history, and gave its commercial team clearer evidence for range and growth decisions.
30% less timeSpent preparing commercial reports
4major retailers brought together in one consistent weekly view
104weeks of category and retailer history rebuilt
~2,700records completed and correctly matched to products
30%less time spent preparing commercial reports
The challenge
Golden Acre Foods is a £130 million UK supplier of Halal, Polish and international food products and a certified B Corp, working with Tesco, Sainsbury's, Asda and Morrisons across a diverse and growing portfolio. To manage that portfolio, teams needed to understand which products were growing, how ranges performed by retailer, and whether changes reflected genuine trends.
Thousands of product records had incomplete SKU information. Existing classifications didn't consistently distinguish Halal, Polish and other international ranges. The team also lacked sufficient historical depth to tell whether a category was growing sustainably or simply moving from one week to the next. Rows covering stores with no active distribution were inflating the reported base, and were removed. For a lean business without a dedicated data engineering function, maintaining this internally would have required time and resources better focused elsewhere.
What we changed
Optia took responsibility for processing and harmonising Golden Acre's weekly data across Tesco, Sainsbury's, Asda and Morrisons, delivered every Wednesday through a repeatable process designed around the commercial team's reporting timetable.
Working with Golden Acre, Optia built and maintained a practical classification structure separating Halal, Polish and other international food products, and resolved around 2,700 incomplete SKU records. Optia also processed, standardised and loaded 104 weeks of historical data, giving Golden Acre two complete years of comparable performance for the first time.
When a five-week gap appeared in the Asda data, Optia identified the missing periods, documented the issue, and coordinated the correction and reload with the source provider rather than leaving an unexplained break in the reporting.
The results
Golden Acre now receives a consistent weekly view of performance across four major retailers: two full years of category and retailer history, weekly data delivered reliably every Wednesday, and around 2,700 incomplete SKU records resolved. Golden Acre reports that report preparation time has fallen by around 30%.
As Golden Acre places new products into test and expands its ranges, the team can now evaluate performance using consistent historical retailer evidence rather than manually assembling the picture each week.
In their words
“There is definitely a need for us to work with someone like Optia, who understands how to manipulate huge amounts of data into small, useful pieces of information.”
Commercial Manager, Golden Acre Foods
Is this your problem too?
Tell us what is slowing your commercial decisions down and we will show you how we would approach it, including a free assessment.
One board-ready view across six categories and sixteen competitors
How Samworth Brothers replaced a fragmented monthly reporting process with a consistent view of category, retailer and competitor performance across the group.
Around one weekReclaimed from every monthly cycle
6categories measured through one consistent commercial model
16competitors benchmarked alongside group performance
5external data sources harmonised with internal category reporting
~1 weekreclaimed from every monthly reporting cycle
The challenge
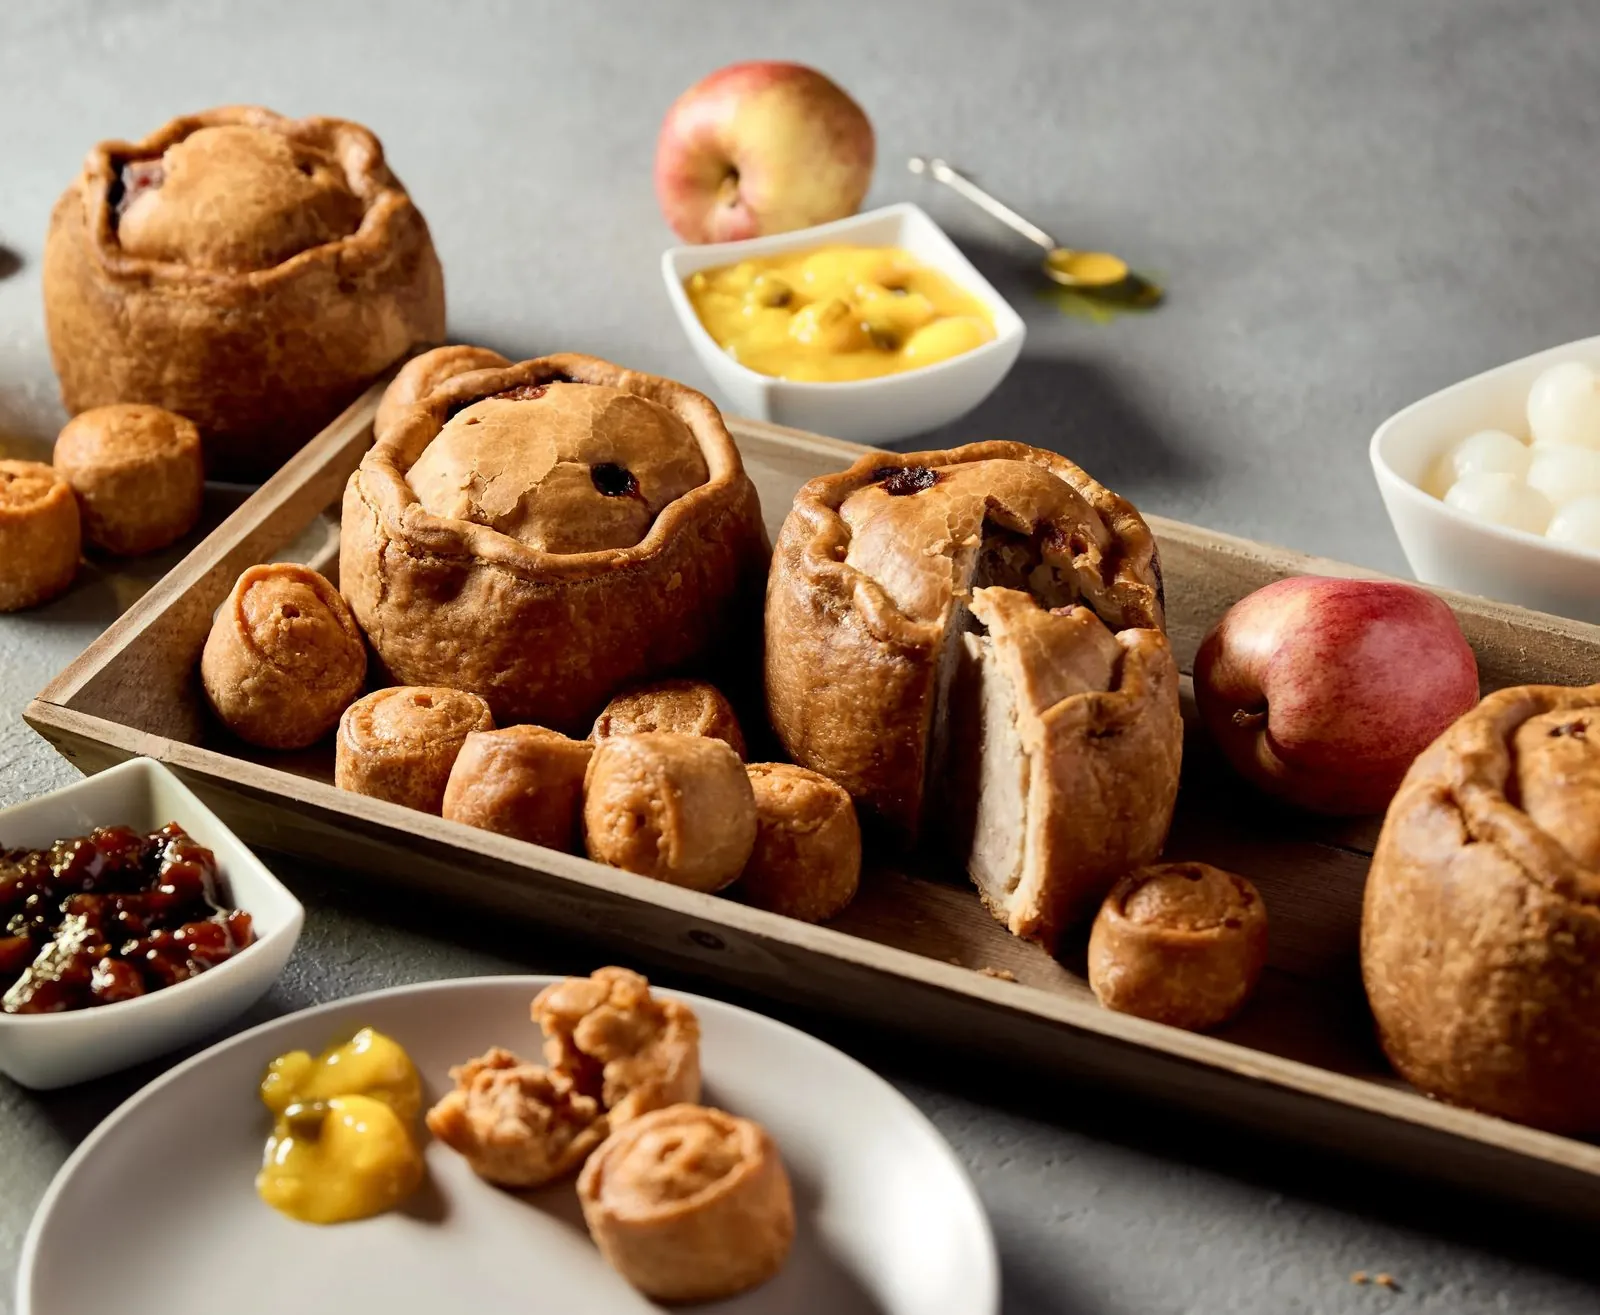
Samworth Brothers, the family-owned food group behind brands including Ginsters and Soreen, operates across meals, sausages, savoury pastry, food to go, sliced cooked meats and cake. Each operating company reported its own results using its own calculations, definitions and process, and bringing those submissions together for the group executive board required a substantial monthly Excel exercise consuming around a week of each cycle.
Analysts estimated that around 80% of their time was spent gathering, cleaning and preparing data rather than interpreting it, limiting the time available to answer the commercial questions that mattered: which categories were gaining or losing momentum, how the group compared to the wider market, and which competitors were driving growth. A later data quality review also identified reporting errors that had previously gone unnoticed.
What we changed
Following a competitive tender, Optia brought together five external sources (NielsenIQ EPOS, Kantar, Dunnhumby, Sakana and Nectar) with internal category submissions to create a single, maintained view of the GB market. The model standardises definitions and calculations across all six categories, allowing like-for-like comparison. During the transition, users could switch between the new standardised calculations and the previous methodology to build confidence in the new approach.
The resulting Power BI dashboard covers total GB market performance, individual category analysis, retailer performance, and competitor benchmarking against 16 strategically relevant names including Greencore, Cranswick, Pilgrim's, Compleat Food Group, Pukka Pies and Finnebrogue. It is delivered into Samworth's own Power BI tenant with SharePoint ingestion, so the group keeps control of access, governance and distribution.
As part of implementation, Optia carried out a structured data quality review across source files, calculations and outputs, identifying several previously undetected reporting errors, which were investigated, corrected and incorporated into the new standardised process.
The results
Samworth Brothers now has one board-ready view across six operating categories: a single reporting model replacing manual Excel consolidation, consistent calculations across all six categories, and category, retailer and competitor performance visible together. Samworth Brothers reports reclaiming around a week from each monthly cycle. The first working version was delivered and demonstrated around three months after the initial discovery discussion.
In their words
“We were going to go and create another chart, which seems crazy in today's world. The dashboard is brilliant, this is exactly the kind of thing we needed. Seriously, thank you so much for the effort and everything that you put into this, and using your brains and your knowledge and your experience to create it.”
Group Head of Category, Samworth Brothers
Is this your problem too?
Tell us what is slowing your commercial decisions down and we will show you how we would approach it, including a free assessment.
A self-serve view of sales, promotion, pricing and distribution
How Vit Hit turned complex market data into a self-serve view of sales, promotion, distribution and retailer performance.
3 yearsOf weekly history for trend analysis
3categories brought together in one commercial view
3market levels, from total grocery to impulse and discounters
5performance measures covering sales, promotion, pricing and distribution
3 yearsof weekly history available for trend and performance analysis
The challenge
Vit Hit competes across several parts of the soft drinks market, spanning mineral water, carbonates and ambient juice drinks. Previous reporting gave the team a high-level view but limited ability to investigate what was driving the numbers.
Was sales growth coming from stronger distribution or better rate of sale? Which retailers were performing best? Was promotional activity generating incremental volume? The information existed, but turning it into answers required more preparation and analysis than the sales team could realistically undertake themselves.
What we changed
Optia created a consistent market model covering three relevant soft drinks categories across three levels of the Great Britain market, tracking five measures: value and unit sales, price, promotional performance and weighted distribution. Three years of weekly history were loaded to provide the context needed to distinguish short-term movements from longer-term trends.
One of the most important additions was the ability to view distribution and promotional performance alongside sales, helping surface whether changes were being driven by wider or narrower distribution, promotional activity, price, or stronger underlying sales performance. The dashboard was designed to be explored rather than simply presented, with filters by retailer, time period, format, brand and market, and Optia trained the team to use it directly.
The results
Vit Hit gained a consistent view of its performance across three categories and three market levels, with sales, promotion, pricing and distribution visible together: three years of comparable weekly history, visibility of distribution alongside sales and promotion, and a self-serve dashboard the sales team could use to investigate its own commercial questions. The monthly refresh became a regular source of insight, giving users a clearer view of what had changed and where further action might be required.
Is this your problem too?
Tell us what is slowing your commercial decisions down and we will show you how we would approach it, including a free assessment.
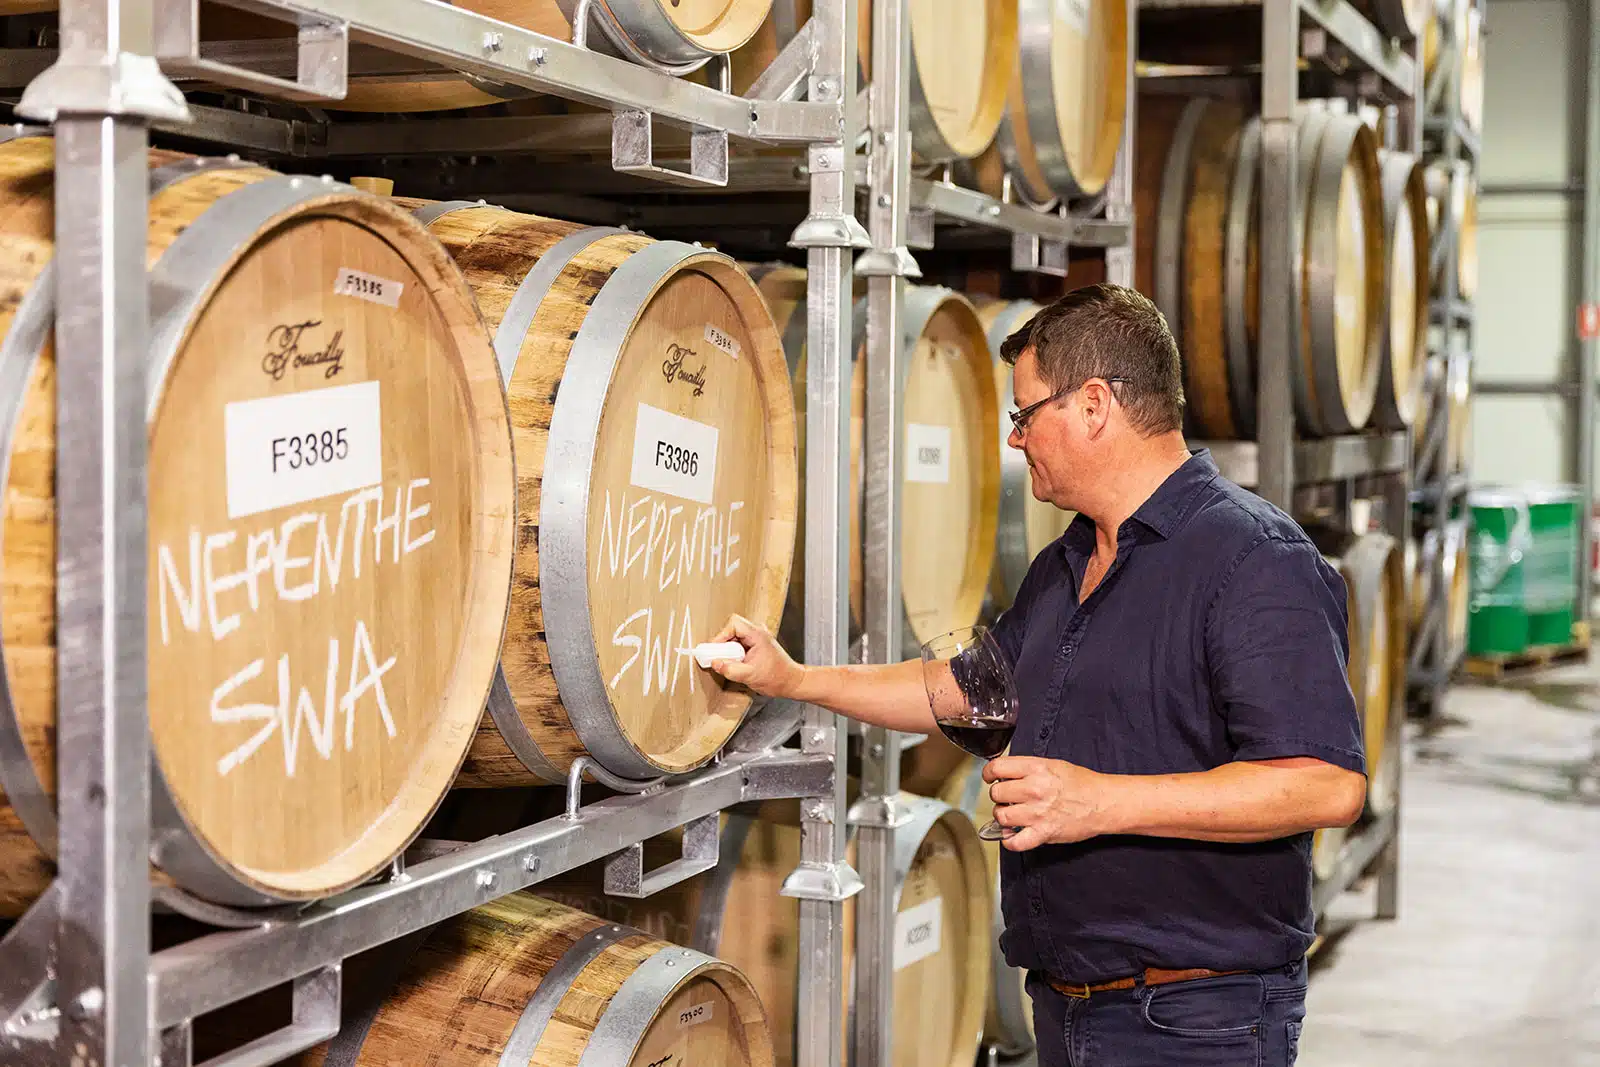
International Beverage is rebuilding monthly leadership reporting so it no longer depends on one person
How International Beverage is turning a manually assembled monthly leadership pack into an automated reporting process spanning market, brand and internal sales data.
156 weeksOf market history loaded, up from 13
Work in progress
Watch this space.
First live reporting cycle targeted for September 2026.
6data sources brought together in one reporting model
20markets covered in the leadership reporting framework
156weeks of history loaded for long-term market analysis
3priority countries: the UK, the US and China
The challenge
International Beverage, the spirits business behind Old Pulteney, Balblair, Speyburn and Caorunn, relied on one insight manager to build its monthly leadership reporting by hand. Each cycle involved collecting data from multiple sources, refreshing Excel templates and pasting static outputs into PowerPoint.
The process depended heavily on his knowledge of where the data came from and how the final report needed to be assembled. Market data, internal shipments, distributor depletions, brand health information and annual market measures all arrived at different frequencies and followed different reporting calendars, meaning much of the consolidation still happened manually behind the scenes.
What we're changing
Optia is creating a single reporting model bringing together six external and internal data feeds, with initial scope covering market data for the UK and US, distributor depletion information from China, internal shipment data, and IWSR and Kantar sources. The underlying model also resolves differences in reporting calendars, since market data may follow a 13-period structure while International Beverage reports monthly against an October financial year. The leadership reporting framework covers 20 markets in total; the UK, the US and China are the initial scope being built first, not the whole framework.
Rather than replacing the existing leadership pack, the same governed model will serve two outputs: an interactive Power BI environment and the existing monthly PowerPoint, both generated from the same numbers. Optia has also loaded 156 weeks of historical data, up from the 13 weeks previously available, giving the insight team a much stronger basis for interpreting seasonality and momentum.
In their words
“I am basically the power user and I am essentially the person who is doing all this manual work. Really my time should be spent doing more insight work rather than data analysis.”
Category and Consumer Insight Manager, International Beverage
Is this your problem too?
Tell us what is slowing your commercial decisions down and we will show you how we would approach it, including a free assessment.
Connecting market demand, distributor sales and supply across five European markets
How Samyang is replacing fragmented monthly reporting with one view of sell-out, sell-through and sell-in across Europe.
5 European marketsInto one consistent commercial model
Work in progress
Watch this space.
First dashboards targeted within six weeks of sign-off.
5European markets brought into one consistent commercial model
3data layers connected: sell-out, sell-through and sell-in
2 daysper market of manual Excel preparation targeted for removal
6 weeksfrom sign-off to the first dashboards
The challenge
Samyang Foods has expanded rapidly across Europe, driven by the growth of the Buldak brand, managed from Amsterdam across the UK, Germany, France, the Netherlands and Poland. Each market came with different data structures, retailer definitions and product classifications, and three different views of the business (retail market data, distributor files, and internal SAP shipments) were being managed separately.
When those numbers disagreed, the team had no simple way to explain why, which mattered commercially: rapid growth had already created reported stock pressure, while major retail relationships in the Netherlands and Germany were reported as becoming harder to manage. The insight team was spending roughly two days per market preparing data before analysis could begin.
What we're changing
Optia is creating a common data model across all five countries, bringing together sell-out, sell-through and sell-in, combining retail audit data with internal SAP shipments and distributor reporting under a consistent product structure so a product can be compared the same way from Warsaw to Manchester. QA complaints and trade marketing activity are also in scope. The model is delivered through Power BI.
The most important change is the ability to compare the three layers side by side, giving insight and supply chain teams a shared evidence base to investigate whether a gap is caused by inventory build, distributor reporting, retail coverage, supply constraints, or a genuine change in demand. The new model will also allow distributor-declared performance to be compared with independently measured retail coverage. It is designed to make the difference between the three layers explainable, not to make distributor-reported and retail-measured numbers agree: syndicated retail data covers only the measured part of the market.
Expected results
The first dashboards are targeted within six weeks of sign-off. Once operational, the model is designed to give Samyang one consistent view across five European markets, sell-out, sell-through and sell-in visible together, manual preparation time returned to the insight team, and a stronger basis for range, supply and market planning as the Buldak business continues to expand.
In their words
“You have some great charts about companies spending 80% of the time cleaning the data and 20% using the actual numbers. Actually you can change this to 95 to 5. Probably our case. And I am not joking.”
Team Leader, Strategic Planning, Samyang
Is this your problem too?
Tell us what is slowing your commercial decisions down and we will show you how we would approach it, including a free assessment.
From total trade reporting to connected management insight
How Bacardi moved from manually combining market channels to automating management reporting across eight business systems.
40+ hours a monthOf manual reporting removed
8source systems connected into management reporting
2trade channels combined into one total trade view
40+hours a month of manual reporting removed
Days → minsfor key reporting processes
The challenge
Bacardi's commercial and management teams were working with valuable data across multiple parts of the business, but that information was rarely available in one consistent view. On-trade data from bars and restaurants and off-trade data from retailers arrived separately and followed different structures, and producing a total trade view required manual reconciliation that wasn't always completed, so teams worked from a partial picture.
Separately, commercial, finance, CRM, retailer, distributor, HR, supply chain and forecasting data were spread across systems maintained through a complex set of interlinked Excel files, with each reporting cycle requiring repeated preparation and reconciliation.
Project 1
Creating a total trade view
What we changed
Optia created a consistent model bringing on-trade and off-trade together into a single total trade view, then automated the monthly reporting cycle so the two sources no longer needed manual combination. Commercial users could access and adapt the resulting analysis themselves.
The results
More than 40 hours of monthly reporting effort removed, report generation reduced from days to minutes, and greater control for commercial teams without routine IT dependency. Bacardi records approximately $40,000 in annual cost avoided, an estimate rather than a measured financial result, reported in US dollars.
Project 2
Connecting management performance
What we changed
Optia consolidated data from eight areas of the business (CRM, finance, market data, retailer data, distributor reporting, HR, supply chain and forecasting) into one automated reporting model, replacing a high-maintenance interlinked spreadsheet process. Forecasting was connected to the same underlying data model rather than treated as a separate manual exercise.
The results
One dashboard replacing the previous spreadsheet process, automated KPI reporting across commercial and operational sources, and manual preparation removed from the recurring reporting cycle.
Two projects, one principle
The first project asked how Bacardi was performing across the total market. The second asked how the wider business was performing across its key KPIs. In both cases, the answer required information from multiple sources to be cleaned, connected and presented consistently, replacing manual consolidation with repeatable data processes.
Is this your problem too?
Tell us what is slowing your commercial decisions down and we will show you how we would approach it, including a free assessment.
Turning a complex maintenance plan into a schedule the operator could trust
How QTS replaced an expert-built spreadsheet process with a constraint-based maintenance plan for a 45MW hyperscale data centre, then compressed twelve months of work into nine and a half when the build programme changed.
12 months into 9.5After the build programme changed
45MWsite scheduled end to end
12 → 9.5months, after the handover programme changed
3build phases coordinated into one maintenance plan
12equipment classes scheduled through one controlled calendar
The challenge
QTS needed to build the planned preventive maintenance schedule for a new 45MW hyperscale data centre containing thousands of assets across twelve equipment classes and three separate construction handover phases. Every maintenance date depended on a network of operational constraints: redundant systems couldn't be taken offline together, cooling equipment had seasonal restrictions, and some assets shared physical spaces or needed maintenance in a defined sequence.
The existing plan, built manually by experienced, time-poor in-house individuals, was inconsistent and flawed. The problem was the thousands of interconnected decisions adding pressure and mismatches in scheduling: there was no simple way to demonstrate every rule had been respected. The plan depended on the sustained concentration of one experienced individual who also had a new site to bring into operation.
What we changed
Optia converted QTS's maintenance requirements into a constraint-based scheduling model. The model understands which systems provide redundancy for one another, accounts for relationships between generators, UPS equipment and transfer systems, and encodes seasonal restrictions and shared service spaces directly, so it cannot produce a valid schedule unless the constraints are satisfied.
Once critical rules are satisfied, the model optimises how work is distributed so maintenance doesn't cluster into unmanageable peaks. Daily service volumes are capped and work is sequenced across the building to cut unnecessary movement of engineers and specialist equipment. The final deliverables included the maintenance schedule, a monthly planning view and a validation file, with Excel deliberately retained as the primary output to match how site engineers and leadership needed to work.
When the site handover programme moved, the maintenance workload originally planned across twelve months had to fit into approximately nine and a half. Optia reconfigured the model around the revised dates and returned a new plan within five days, preserving the agreed redundancy, sequencing and operational constraints.
The results
QTS received a fully deconflicted annual maintenance calendar covering the 45MW site, giving a controlled basis for committing dates to engineers and vendors. When the construction programme changed, the same approach compressed twelve months into nine and a half and produced the revised schedule within five days. The European implementation has since become a reference point for the wider organisation, with interest from the US team in applying the same model.
In their words
“I couldn't have done this confidently whilst doing all the other work that I've needed to do. You have been able to take that off my plate and you provided a PPM planner, which is exactly what I asked for. So it is everything.”
Operational Readiness Director, QTS
Is this your problem too?
Tell us what is slowing your commercial decisions down and we will show you how we would approach it, including a free assessment.
Giving every school head the numbers they can actually influence
How Inspired Learning Group turned fragmented finance, occupancy, admissions and payroll data into role-specific reporting across around 25 schools and nurseries.
Around 25 settingsInto one reporting environment
~25settings brought into one reporting environment
5source systems connected into a consistent model
5reporting levels, from individual setting to group
Weekly + monthlyreporting matched to how each part of the business operates
The challenge
Inspired Learning Group has grown through acquisition, bringing together schools and nurseries with different operating models, systems and reporting rhythms. Much of the traditional financial reporting wasn't designed around the decisions individual heads could actually make: a full group P&L might contain hundreds of lines, but only a small proportion related to the levers available to them.
The information needed to manage those levers was spread across five different systems: finance in NetSuite, school occupancy and discounts in iSAMS, nursery data in Famly, admissions in Digistorm, and payroll separately again. Reporting cadence also varied, since nursery occupancy can change meaningfully week to week while school reporting follows a more monthly rhythm. Some source systems held only the current state, so when a pupil joined, left or moved stage the previous position could disappear unless it had already been captured.
What we changed
Optia connected the five core systems into one reporting environment covering finance, occupancy, admissions and people, then structured the reporting around who needed to make the decision. Individual heads and nursery managers see their own setting; leadership can move through nursery, prep, all-through school and group-level views. That is five levels in all, from the individual setting up to the group.
For each setting, the reporting connects occupancy against budget and capacity, revenue and staffing performance alongside staff cost as a percentage of revenue and agency cost as a percentage of staff cost, admissions from enquiry through to deposit, and HR views tracking vacancies, starters, leavers and absence. Nursery files are prepared weekly in time for Monday marketing meetings, while schools operate to a more monthly rhythm, with a review workspace used before publication and access controlled so heads see their own setting.
The results
The former Finance Director reports that the dashboards now form the basis of monthly school-by-school discussions. Heads and nursery managers receive information focused on the parts of the business they can influence, while the group can compare occupancy, admissions conversion, revenue and payroll performance across settings using consistent definitions, allowing leadership to see which settings are performing well and investigate what others can learn from them.
In their words
“If we get those wrong, the dashboards are almost meaningless because they’re being referenced against a meaningless target and therefore any decision points that come out of it are rendered slightly obsolete because the data is already out of date.”
CFO, Inspired Learning Group
Is this your problem too?
Tell us what is slowing your commercial decisions down and we will show you how we would approach it, including a free assessment.
Campari UK brings on-trade and off-trade into one view without average of averages that would never match
How Campari UK brought on-trade and off-trade performance together in one commercial view while preserving the differences between the two channels.
4 data providersReconciled into one Total Trade view
14dashboard pages covering market, brand, supplier and consumer performance
4data providers reconciled into one reporting environment
2channels brought together in a Total Trade view
Monthlyrefresh now run by Campari's own team
The challenge
For spirits brands, on-trade and off-trade performance are closely connected, but there was no ready-made Total Trade dataset for Campari. The two channels came from different sources, followed different structures, and measured some KPIs in fundamentally different ways: distribution meant weighted distribution in retail but a physical outlet count in the on-trade.
Category definitions also differed between sources, particularly in low and no alcohol, and the two channels could arrive on different release schedules, meaning a combined number might look plausible while actually comparing different periods. Internally, the reporting split reflected the data split, with no single view across the full market. One analyst owned on-trade, another owned off-trade, and the outputs were produced manually in Excel. Off-trade carries a large share of volume while on-trade builds visibility, trial and brand equity, so neither channel answers the question on its own.
What we changed
Optia built the Total Trade model in the reporting layer rather than assuming the sources could simply be joined together, aligning category definitions and normalising naming while preserving genuine differences. Selecting off-trade distribution returns the appropriate weighted distribution measure, while selecting on-trade returns the physical outlet count, so the dashboard never averages or combines measures that don't mean the same thing.
Optia also built controls around period alignment: if the underlying periods didn't match, a Total Trade figure simply wasn't published, prioritising a correct answer over an apparently complete one. The finished reporting environment spans Total Trade market and supplier views, brand scorecards for Campari, Aperol, Courvoisier and Wray & Nephew, and consumer funnel measures.
In November 2025, Optia completed a full knowledge transfer to Campari's application support team, and the monthly refresh is now run internally.
The results
Campari now has a single reporting environment covering on-trade and off-trade performance: one Total Trade view across both channels, four data providers reconciled into a common model, manual Excel reporting replaced by a structured process, and the monthly refresh transferred to Campari's own support team. Brand, category and insight teams can now examine how the two sides of the market interact rather than reviewing them as separate stories.
In their words
“We are really pleased with the final dashboard and grateful for Optia's efforts. I'm excited to share this with our wider teams and stakeholders.”
Category and Insights Controller, Campari UK
Is this your problem too?
Tell us what is slowing your commercial decisions down and we will show you how we would approach it, including a free assessment.
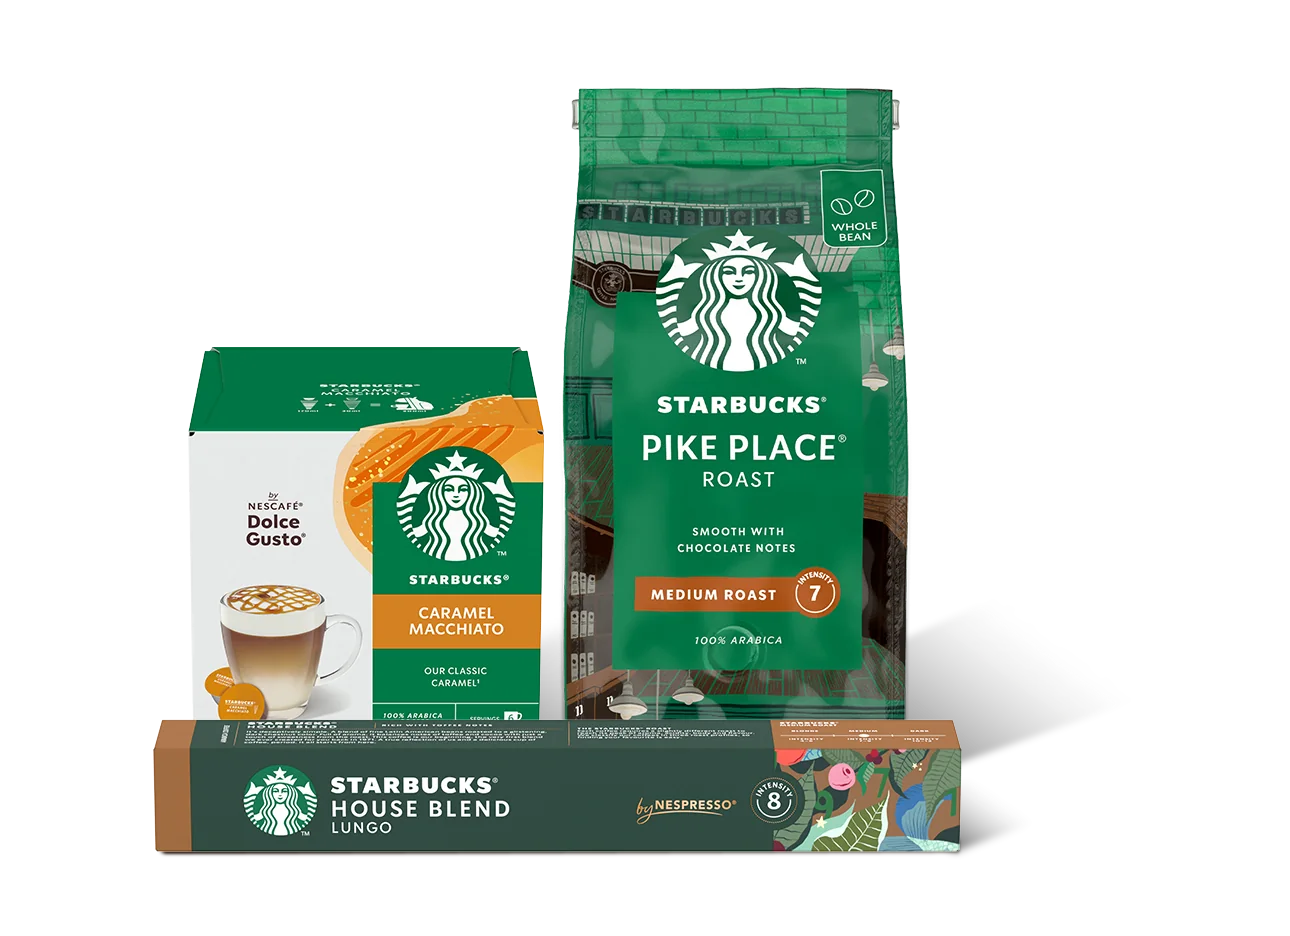
From static market reporting to an intelligence layer for commercial teams
How Starbucks EMEA moved from fragmented monthly reports to a consistent multi-market view, then explored how AI could turn those numbers into commentary, answers and recommendations.
16 marketsInto one reporting model
16markets brought into one reporting model
33monthly reports consolidated into automated reporting
13missing periods reconstructed to restore trend history
3intelligence perspectives designed around different commercial questions
The challenge
Starbucks EMEA needed to understand performance across 16 markets, but the existing process produced 33 separate monthly reports covering countries, formats and the EMEA total. The information was available but difficult to compare, interrogate and trend consistently, and historical gaps made the picture harder to interpret. Analysts still had to work through the reporting manually to explain what had changed and why. The stated objective was not to replace dashboards or analysts.
Phase 1
Creating the reporting foundation
What we changed
Optia consolidated reporting across 16 countries into a single model, creating consistent views for individual markets, the wider EMEA region and key commercial cuts. Thirteen missing reporting periods were reconstructed, restoring historical continuity, and static monthly reporting was replaced with a more flexible, explorable environment.
The result
A stronger foundation for understanding market, brand and category performance across the region, and the structured data foundation required for the next question: could the reporting explain itself?
Phase 2
Adding the intelligence layer
What we changed
Optia built an intelligence layer designed to read the underlying reporting and generate a first draft of monthly commentary automatically, with predefined prompts covering market performance, trend analysis and competitive movement. Distinct agent perspectives were created to reflect that a brand manager, a strategic leader and a data specialist need different things from the same numbers, covering brand positioning and activation, market priorities and investment, and statistical or structural significance, and the work explored a conversational way of interacting with the data, where a question could return a number, a written explanation or a generated visual.
What it proved
The intelligence layer was tested against real market extracts, which proved the potential of automated commentary and role-specific interpretation, but also confirmed that where underlying market files were structured differently, AI couldn't make those inconsistencies disappear. The data still needed to be aligned first.
The results
Starbucks EMEA moved from fragmented monthly reporting towards a more integrated approach to commercial insight: a consistent view across 16 markets, restored historical periods, and a clearer specification for the intelligence capabilities that mattered most, including role-specific perspectives and automated market commentary.
In their words
“A really real step forward versus what I saw before Christmas. Definitely moving in the right direction.”
Insights and Analytics, EMEA Channel Development, Starbucks EMEA
Is this your problem too?
Tell us what is slowing your commercial decisions down and we will show you how we would approach it, including a free assessment.
Seeing category performance at the level where share is actually won and lost
A project delivered by the team now operating as Optia, bringing eleven adhesives and stationery categories into one commercial view, from total market performance down to individual SKU and retailer.
11 categoriesInto one consistent reporting model
11categories brought into one consistent reporting model
6brands tracked down to individual SKU
3major UK grocers compared in one commercial view
2 yearsof weekly history available for trend analysis
The challenge
Henkel competes across eleven adhesives and stationery categories, from stationery tapes and glue sticks to sealants, construction adhesives, wood glue, PU foams and humidity absorbers. Competitive sets, pack formats and retailer ranges all vary, and the same underlying product can appear as a single unit, multipack, refill or variant with different descriptions depending on retailer and source data.
More importantly, performance can change at a much lower level than the category total. A competitor might gain distribution on a particular SKU, or private label might gain share in a specific sub-category while the overall market looks stable, long before it becomes visible in the headline number.
What we changed
The project consolidated market data across all eleven categories into a consistent hierarchy covering category, sub-category, pack structure, brand and individual SKU, resolving product mapping differences across retailers before the information reached the reporting layer.
The Power BI environment let users move progressively from total category performance through brand, sub-category, retailer and individual product results, with a dedicated retailer view across the three major grocers and competitor reporting showing Henkel brands (Loctite, Sellotape, Pritt, UniBond, No More Nails and Solvite) alongside private label and competitors including Bostik, Gorilla, Scotch, 151 and Securefix. Measures included unit and value sales, volume, average price per volume, weighted distribution, stores selling and household penetration across two years of weekly history. Measures are available across moving annual total, year-to-date, 52-week and shorter rolling periods.
The results
The project created one consolidated source of UK market data across eleven categories, with a consistent view from total category down to individual SKU, competitor and private label performance alongside Henkel's own brands, and two years of weekly history for understanding trends. The environment shows where share is moving, what is driving it, and where the next commercial action might be required.
Is this your problem too?
Tell us what is slowing your commercial decisions down and we will show you how we would approach it, including a free assessment.
A Tier-One Global BankFinancial services · Confidential engagement
Making KYC data traceable across a complex APAC regulatory environment
How Optia supports the client data management and risk assessment processes behind a major bank's KYC operation, with auditability, resilience and continuity built into the delivery.
Zero Priority 1 incidentsDuring peak regulatory windows
Client details are withheld under a confidentiality agreement. The numbers and the work are real.
30,000records processed through the risk assessment build
ZeroPriority 1 incidents during peak processing windows
The challenge
A global bank operating across multiple APAC jurisdictions has to manage more than one version of regulatory reality, since local requirements differ and individual KYC hubs can develop their own representation of the same client. The challenge isn't simply bringing information together; the bank also needs to demonstrate how a result was produced, which data was used, what rules were applied, and who interacted with the process. Peak regulatory windows make that requirement even more important, since the platform has to remain stable while volumes and scrutiny are at their highest.
What we support
Optia operates as a delivery and support partner within the wider programme, maintaining the data pipelines and global client inventory feeds that underpin the workflow, together with the date and business-rule logic required for regulatory processing. There is deliberately no dashboard layer; the value sits in making sure the right data reaches the right process with enough traceability to understand how the result was produced.
Optia implemented an automated daily activity feed delivered through secure file transfer, allowing user interactions with the platform to be monitored continuously, alongside stronger identity mapping, access controls and pre-peak system health checks. Optia also migrated the platform from PostgreSQL to a new analytical engine alongside a front-end upgrade, without interrupting the regulatory reporting cycle.
The results
The programme has created a more centralised approach to managing client information across the regional KYC operation: a consistent client data management process across multiple jurisdictions, automated daily user activity monitoring, stable support through high-volume regulatory windows, and platform migration delivered without disrupting the regulatory cycle. Success here is measured by what doesn't happen: no critical outage, no broken regulatory cycle, no Priority 1 incident during the peak window.
Is this your problem too?
Tell us what is slowing your commercial decisions down and we will show you how we would approach it, including a free assessment.
How Oracare Group created a consistent monthly view across a multi-country practice estate without changing how individual practices operated.
3 practice brandsInto one reporting model
3practice brands brought into one reporting model
Multi-countryestate reported through one consistent structure
Monthlyreporting delivered from a consolidated source
The challenge
Oracare Group operated three separate dental practice brands across multiple countries, each generating patient, treatment and revenue information in its own structure and following its own local processes. Producing a consolidated view meant bringing those sources together manually every month, and a revenue figure from one practice was only useful alongside another if both had been prepared using the same definitions.
The group didn't need a completely new reporting philosophy. It needed the information it already recognised to arrive consistently and mean the same thing across every setting.
What we changed
The project consolidated data from across the practice estate into one prepared source, standardising different structures across brands and countries before they reached the reporting layer, so group-level figures could reconcile back to the underlying practices without requiring every local operation to change how it worked.
Rather than replacing the group's existing reports with something entirely new, the project replicated the reporting leadership already knew, then extended and delivered it through a shared dashboard as part of a regular monthly cycle, improving the consistency of the information underneath. Standardising in the preparation layer keeps change away from the practices, at the cost of concentrating ongoing maintenance in that layer.
The results
Individual practices could continue operating locally, while the group gained a common view across brands and countries: a consolidated source of practice data across three brands and multiple countries, existing management reporting replicated and extended within a shared dashboard, and a consistent monthly reporting cycle. That made it easier to compare performance across the estate and understand how individual practices contributed to the group result.
Is this your problem too?
Tell us what is slowing your commercial decisions down and we will show you how we would approach it, including a free assessment.
Policy owner: Chief Information Security OfficerEffective date: 1 August 2025
Our policy
At Optia Data we take the privacy and security of your personal information very seriously. When You use the Website, App or otherwise communicate with Us, You will be providing Optia Data with certain information, some of which We will collect. This information could potentially be Personally Identifiable Information (PII). To help You understand what information We collect, how it will be used and how We protect it from disclosure, We’ve written this Privacy Policy. If You’re providing Optia Data with PII of an individual other than You, it is your responsibility to ensure You have that individual’s consent and all rights to share this information with Optia Data.
We value your information and privacy as much as you do. We don’t sell or rent any of the information we collect or process to third parties. This includes Your PII and/or any information you upload to our App. Your access to and use of our Services is subject to our Terms of Service. By using our Website, App and/or communicating with Optia Data, you agree to this Privacy Policy.
Cookies
Your current choice. You can change which cookies we may use at
any time, and withdrawing is as easy as giving:
.
Analytics and marketing cookies are off unless you turn them on.
In order to run Our services (Our App and Website), Optia Data utilises Cookies, Pixel tags and Logs. Optia Data will issue cookies to your computer when You use the Website and/or App, for them to run properly. If your browser preferences are set up to reject cookies, your access to Our services will be limited. Cookies, pixel tags, and/or logs can be used to identify your IP address, browser type, domain name, and specific web pages through which You click, and/or email messages You open. Cookies help Us provide additional functionality to Our services and analyse service usage more accurately. We will not collect personal information (except with your permission) via Our use of cookies.
What information we collect
When You use Our Website, contact Us, use the Optia Data App, create an account to use the App, and/or someone, such as your organisation’s administrator, creates an account on your behalf, Optia Data will collect the following PII:
Your name
Your email address
Information You provide via fillable forms or text boxes (including your browser’s address bar)
IP address
Unique identifier(s) We assign to users as part of monitoring user experience
Information regarding the device You are using, including the hardware model, operating system and version, unique device identifiers, network information, IP address, and/or App information
Information about all of your interactions with the App (Usage Data) and how the App is performing (Data). Users may disable tracking of Usage Data for the App by disabling tracking for all users of the App through the administrator panel
Information gathered through cookies, pixel tags, logs, or other similar technologies. See the “Cookies” section above
Personal health information (PHI)
What is personal health information?
Personal Health Information (PHI) is any information that can be used to identify an individual and their health condition. This includes, but is not limited to, information such as:
Name
Address
Date of birth
Social Security number
Medical history
Treatment records
Lab results
Genetic information
Does Optia Data collect PHI?
Optia Data does not knowingly collect or store PHI. Our platform is not designed to handle sensitive data like health information.
How we handle PHI inadvertently uploaded
In the unlikely event that PHI is uploaded to our platform, we will take the following steps:
We will take all reasonable steps to identify the PHI.
We will restrict access to the PHI to authorised personnel only.
We will work with the individual or organisation that uploaded the PHI to delete it securely.
We will report any breaches of PHI to the appropriate authorities as required by law.
Your responsibilities regarding PHI
You are responsible for ensuring that you have the legal right to upload any PHI to our platform. You should also obtain any necessary consents from individuals before uploading their PHI.
How we use your information
Optia Data may use your information for the following purposes:
To respond to your requests for information, products, or services, and to provide customer service and support
To administer your App User Account
To enable You to access and use of the App, and to enable You to communicate, collaborate, and share information with those You designate
To send You technical notices, updates, security alerts, and support and administrative messages
To inform You about our products and services
To monitor your user experience
For legal compliance, such as to enforce our legal rights, to comply in good faith with applicable laws, and to protect users of the App
To enable Optia Data to proactively help customers maintain the performance and functionality of deployments of the App
To enable Optia Data to verify your license to use the App
For other general business purposes, such as: to provide, operate, maintain, make modifications to and improve the App, and for marketing, advertising, research and development
For other purposes about which We notify you
We will notify you and/or ask for your authorisation before using your information for any other purposes. Optia Data also may collect via the App information that does not identify or locate You personally and We reserve the right to maintain, disclose, or otherwise use such information without limitation, including aggregated with other information to improve the App.
Artificial intelligence (AI) and machine learning (ML)
Optia Data affirms that it does not use, develop, improve, or train generalised/non-personalised AI and/or ML models by using customer data either uploaded by the users or pulled through third party APIs available on Optia Data platform. Optia Data also does not transfer customer data either uploaded by the users or pulled through third party APIs to any third-party AI/ML models or tools.
Who we share your information with
Except as provided below, Optia Data will not share PII with third parties, unless You have consented to the disclosure. In certain circumstances, Optia Data may share certain PII with third party service providers that need your information to provide the following operational or other support services to Optia Data:
Email marketing
Data management
Database hosting
Payment card processing
Shipping services
Communication services
Cloud services
To ensure the confidentiality and security of your PII, such service providers must agree to safeguard your PII shared with them, if any. These service providers are also restricted by contract from using your PII in any way other than to provide services for Optia Data. Optia Data does not share the information contained in your organisation’s App User Accounts with any third parties. Optia Data may also provide your PII to third parties in the following special cases:
Whenever we believe that disclosure is reasonably necessary to comply with any applicable law, regulation, legal process, government request or a judge request, including in connection with national security or law enforcement requirements (e.g. to respond to subpoenas and court orders, to exercise legal rights or defend against legal claims, to investigate and/or take action against illegal activities, suspected fraud, threats, enforcement/violation of our Terms of Service, agreements and policies). In each case, We will make reasonable efforts to verify the validity of the request before disclosing your personal information.
To protect the security or integrity of the App and/or Website.
To respond to an emergency, which We believe in good faith requires Us to disclose information to assist in preventing serious bodily injury or death of any person.
Optia Data may also share or transfer your PII with our subsidiaries, affiliates, and partners, to facilitate our global operations and in accordance with applicable laws. We may also provide your PII to a third party in connection with a merger or acquisition of Optia Data, either in part or in whole, or the assignment or other transfer of the App. If such third party proposes to materially change the privacy practices described in the Privacy Policy, You will be informed in a prominent manner enabling You to choose whether to opt-in and agree to the new practices. This applies both for PII collected before and after any merger, acquisition, assignment or other transfer. Your organisation’s admin may contact Us to request that We no longer share its authorised users’ PII.
Where we operate and store your information
We primarily store information collected from You within the European Economic Area, the United States and in other countries and territories. To facilitate our global operations, We may transfer and access such personal information from around the world, including from other countries in which Optia Data has operations. Optia Data is based in and operates the App and site out of the United Kingdom. When We obtain personal information about You, We may process such information outside of the country in which You are located, including in the United Kingdom. The countries in which We process your information may not have the same data protection laws as the country in which You are located. We store your data with Third Parties that are GDPR compliant and store data in GDPR Compliant Countries. We will protect your information as described in this Privacy Policy.
Your rights
According to the applicable data protection legislation, you have certain rights as a so-called “data subject”. Below, we have listed your rights. Your rights include the following:
Right to access. You are entitled to access the personal data that we handle. You are also entitled to receive certain information about what we do with the personal data. Such information is provided in this document.
Right to rectification. Under certain circumstances, you are entitled to correct inaccurate personal data concerning you and to have incomplete personal data completed. Please note that we might not be able to correct inaccurate personal data provided by you due to e.g. the airlines rules, and that such particular change may incur a cost.
Right to erasure. Under certain circumstances, you are entitled to have your personal data erased. This is the so-called “right to be forgotten”.
Right to restriction of processing. Under certain circumstances, you are entitled to restrict how we use your personal data.
Right to data portability. You are entitled to receive your personal data (or have your personal data directly transmitted to another data controller) in a structured, commonly used and machine-readable format from us.
Right to object. You are entitled to object to certain types of handling of personal data that we carry out. This applies to all our activities that are based on our “legitimate interest”.
Finally, you also have the right to lodge a complaint with the applicable data protection supervisory authority.
Retention period
We will not retain your personal information longer than necessary to fulfil the purposes for which it is processed, including the security of our processing complying with legal and regulatory obligations (e.g. audit, accounting, statutory retention terms), handling disputes and for the establishment, exercise or defence of legal claims.
Accessing, changing or deleting your information
You can request access to, change or delete PII Optia Data holds by sending Us an email at [email protected]. You can also opt-out on the use of cookies, logs and/or pixel tags by sending Us an email to the same address. Your request will be verified and We will respond to You as soon as possible in accordance with our legal obligations.
Collection of information by third party sites and sponsors
Our Website and App contains links to other websites, including those of our partners and sponsors, whose information practices may be different from ours. Please consult those third party websites’ privacy notices for further information on how they handle Your information.
User data
All the information You upload in any way to your or your company’s App User Account is User Data. We don’t have access to User Data, it is not collected in any way and we don’t provide it to third parties except for our cloud services and hosting providers, who store the data You feed into your account. You are responsible for all User Data you store in your or your organisation’s User Account. This means You must have the rights to handle, use and reproduce the information You keep in Optia Data and We are not responsible for legal, regulatory or property infringements You might be committing by uploading (or otherwise feeding) information into your User Account.
Marketing emails
To keep You up to date with what’s happening at Optia Data and how to make the most of our services, We’ll occasionally send You emails to your registered email address. If You wish to stop receiving our emails, You can unsubscribe at any time by following the unsubscribe link at the bottom of our emails.
Payment
If You purchase from us, We may collect your credit or debit card number, expiration date, or other payment details (collectively, “Payment Information”). We may provide Payment Information and other personal information to our third party payment processors in order to complete purchases made with Us. Pursuant to the “Who we share your information with” section above, our third party payment processors are bound by contractual obligations to keep such personal information confidential and use it only for the purposes for which We disclose it to them. However, We are not responsible for our third party payment processors’ use of any Payment Information or other personal information they collect in connection with your transactions on the Website.
Age requirements
Our services are not intended to be used by, nor does Optia Data knowingly collect personal information from individuals under the age of thirteen (13). If You become aware that an individual under the age of 13 has provided Us with personal information, please contact Us immediately at [email protected]. If we become aware that an individual under the age of 13 has provided Us with personal information, we will immediately take action to delete such information.
Security
Optia Data will take reasonable and appropriate physical, electronic, and procedural safeguards and security measures in an effort to protect all PII it collects via the App and Website from loss, misuse, and unauthorised access, disclosure, alteration, and destruction. Please note that no electronic transmission of information can be entirely secure. We cannot guarantee that the security measures We have in place will never be defeated or fail, or that such measures will always be sufficient or effective. Any transmission of information is at your own risk. We are not responsible for circumvention of any Website or App privacy settings or our security measures.
Policy updates
Periodically, we may update this Privacy Policy and will make the new version available on this page. If We make any material changes, we will notify you via email and in the App before the effective date of the policy, in order to obtain your consent.
Our European Union representative
Under Article 27 of the GDPR, we have appointed an EU Representative to act as our data protection agent. Our nominated EU Representative is:
Some cookies are needed to make this site work. We would also like to
measure which pages get read, and to recognise the organisations visiting
us. Neither is essential, so both are entirely your call and you can
change your mind at any time. Privacy Policy.
Remembers this choice and keeps the site working. No tracking.
Google Analytics, so we can see which pages are actually read.
Tools that identify the organisations visiting the site, and measure
whether our LinkedIn activity brought you here.